Wednesday, April 4, 2012

The Lovely World of S&P Analyst Price Targets

If you want a good chuckle you can always turn to a S&P stock report. Take for example their recent research report on Netflix. Right there at the top of the report they blessed the stock with a "Buy" rating and slapped a 12-month price target of $135 on it. Who can complain with a 17% gain? Looks like it's time to buy!

Oh wait, what is this on page 3?

Gotta love it! So on the one hand their analyst is saying 'Buy" because with a price target of $135 it is 17% undervalued. Then your later being told that, by the way, our "proprietary quantitative model" says you should lose about 42% listening to that Analyst.

This isn't some one-off thing, in fact, it is amazingly common. How about Boeing? Looks like another buy! Price Target $86. Not a bad 16% gain.
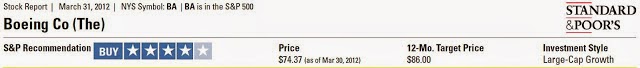
Oh wait......

Sorry, S&P actually says you should lose 27%.

So how about something your not being told to buy? Chipotle...

Don't worry, your not the only person wondering why something has a "Hold" rating when it's price target is 11% lower. However, to the analysts credit the "hold" rating was put on when it was trading at $378 (but don't give too much credit -- why is he recommending to hold something he thinks should go down in price?)

Worse yet, not only does the analyst think it's overvalued but so does S&P's "fair value calculation". By 30% in fact. Yet still no "Sell" rating?

I think you get my point......These "Price Target's" are pure humor. And as you may have guessed, the corresponding star ratings provide nothing useful in performance -- and actually have detracted as you can see in the below performance of their "All Stars" basket of stocks vs the regular S&P 500.


You gotta love these "useful" price targets!

Friday, March 16, 2012

It's Official! "It Is Ridiculous To Be Bearish"!

It's official everybody! "it is ridiculous to be bearish". If you didn't know, now you know! At least that's what Thomas Lee, chief equity strategist at JPMorgan says according to USA Today:
"Stocks are levitating like a balloon" adds Thomas Lee, chief equity strategist at JPMorgan. With stocks undervalued, underowned and cash-rich U.S. companies strong, "it is ridiculous to be bearish," says Lee, adding that the S&P could even take out its record high of 1565.15, set in October 2007."
Now that the S&P 500 (at 1403) is approaching Thomas Lee's original target (1430) for 2012, the "non-ridiculous" equity strategist needs to raise his target, it "could even take out it's record high of 1565". After all, how is JP Morgan gonna sell everyone stocks if their equity strategist doesn't say stocks are going higher?
Thomas had essentially the exact same forecast last year. And, yes, on the very day (April 29th) that markets peaked last year (at 1363) he came out with an increase to his forecast to 1475. At which point the market preceded to fall 19% and finish the year where it started. But seriously everyone, "It is ridiculous to be bearish". 

I mean, you have to be crazy! This guy knows cheap when he sees it. Just look at what he was saying in June 2008 when the S&P 500 was (interestingly enough) at 1360. According to bloomberg:
"The biggest rise in the unemployment rate since 1986 is an ``aberration'' and investors who sold equities today are ``completely misreading'' the outlook for economic growth, according to JPMorgan Chase & Co."
The Dow Jones Industrial Average fell as much as 412 points today after the Labor Department said the jobless rate increased by half a percentage point to 5.5 percent, the highest since October 2004, as an influx of students into the workforce drove the biggest jump in teenage unemployment since at least 1948.
``The surge in unemployment is probably an aberration,'' Thomas J. Lee, the New York-based chief U.S. equity strategist at JPMorgan, said in an interview. ``It's not because there were fewer jobs, it's because there were more people looking for jobs. Stocks are completely misreading the situation.''  
Ya, the surge in unemployment to 5.5% was an aberration. Mish Shedlock over at his blog even called him out at the time in his post "aberration in clear thinking by JP Morgan". So what was Thomas Lee's projection given this "aberration"?
"The strategist said the Dow industrials posted a 30 percent average gain in the 12 months following a jump in the unemployment rate by half a point or more since 1950. A rise in joblessness of that magnitude has occurred 16 times during that period, he said."
"Lee expects the Standard & Poor's 500 Index to climb to 1,450 by the end of this year, according to a Bloomberg News survey on June 2."
The market eventually bottomed 54% below his target. But on the bright side, his target is now less than 50 points away........almost 4 years later.

The reality is it's "ridiculous" to not realize that valuations are NOT cheap EXPENSIVE based on measures that actually have a correlation to longer-term returns. As illustrated in this chart from Doug Short.

I think this is a better representation of expected longer-term returns (chart represents "real" inflation adjusted returns)

Or possibly this, as shown by John Hussman in "Warning: A New Who's Who of Awful Times to Invest"

Can markets go higher? Of course, they always can. But bull markets don't start at a PE10 ratio of 22 (but many losses have resulted from these levels). And the only thing that would be "ridiculous" would be taking this guy seriously. Clearly, his target will always be "higher".

Thursday, March 8, 2012

A Few Crazy Predictions in Global CFO Survey

Duke University and CFO magazine recently released their quarterly Global Business Outlook Survey for the first quarter of 2012. In the survey about 450 CFOs gave their best predictions for the S&P 500. Here are some of their predictions (based on the median response)

- Expected return over next 10 years = 6%/yr
- 10% chance return will be less than 2%/yr over the next 10 years
- 10% chance return will be greater than 10%/yr over the next 10 years
- Expected return over the next year (from 2/17) = 6%
- 10% chance return will be negative over the next year (from 2/17)
- 10% chance return will be greater than 10% over the next year (from 2/17)

Now none of those may seem too crazy. Except I think it is borderline delusional to believe there is only a 10% chance of a negative return over the next year considering current valuations. But if you want to see some truly wacko predictions, take a look at the extreme answers given in the "minimum" and "maximum" response column for each question.

A few of my favorites

- Someone thinks there is only a 10% chance the return over the next year will be LESS than 70%!?!
- Someone thinks the average annual return over the next 10 years will be 60%/yr!?!
- Someone thinks there is only a 10% chance the average annual return over the next 10 years will be LESS than 70%/yr!?!

So what we have there is either some truly crazy CFOs or some CFOs that need to take classes in reading comprehension before completing the next survey.

Wednesday, February 29, 2012

13 Steps For A Greek Exit From The Euro

Everyone by now should know it is in Greece's best interest to exit the Euro. In fact, it is so clear that it appears the only reason for these ongoing "bailouts" is to buy time putting in place the systems needed for the transition. So I present to you the 13 steps for a Greek exit from the Euro courtesy of a paper from Variant Perception "A Primer on the Euro Breakup: Default, Exit and Devaluation as the Optimal Solution" (it is worth a read in it's entirety, but it is long).
"1. Convene a special session of Parliament on a Saturday, passing a law governing all the particular details of exit: currency stamping, demonetization of old notes, capital controls, redenomination of debts, etc. These new provisions would all take effect over the weekend.
2. Create a new currency (ideally named after the pre-euro currency) that would become legal tender, and all money, deposits and debts within the borders of the country would be re-denominated into the new currency. This could be done, for example, at a 1:1 basis, eg 1 euro = 1 new drachma. All debts or deposits held by locals outside of the borders would not be subject to the law.
3. Make the national central bank solely charged, as before the introduction of the euro, with all monetary policy, payments systems, reserve management, etc. In order to promote its credibility and lead towards lower interest rates and lower inflation, it should be prohibited from directly monetizing fiscal liabilities, but this is not essential to exiting the euro. 
4. Impose capital controls immediately over the weekend. Electronic transfers of old euros in the country would be prevented from being transferred to euro accounts outside the country. Capital controls would prevent old euros that are not stamped as new drachmas, pesetas, escudos or liras from leaving the country and being deposited elsewhere. 
5. Declare a public bank holiday of a day or two to allow banks to stamp all their notes, prevent withdrawals of euros from banks and allow banks to make any necessary changes to their electronic payment systems 
6. Institute an immediate massive operation to stamp with ink or affix physical stamps to existing euro notes. Currency offices specifically tasked with this job would need to be set up around the exiting country. 
7. Print new notes as quickly as possible in order to exchange them for old notes. Once enough new notes have been printed and exchanged, the old stamped notes would cease to be legal tender and would be de-monetized. 
8. Allow the new currency to trade freely on foreign exchange markets and would float. This would contribute to the devaluation and regaining of lost competitiveness. This might lead towards a large devaluation, but the devaluation itself would be helpful to provide a strong stimulus to the economy by making it competitive. 
9. Expedited bankruptcy proceedings should be instituted and greater resources should be given to bankruptcy courts to deal with a spike in bankruptcies that would inevitably follow any currency exit.

10. Begin negotiations to re-structure and re-schedule sovereign debt subject to collective bargaining with the IMF and the Paris Club. 
11. Notify the ECB and global central banks so they could put in place liquidity safety nets. In order to counteract the inevitable stresses in the financial system and interbank lending markets, central banks should coordinate to provide unlimited foreign exchange swap lines to each other and expand existing discount lending facilities. 
12. Begin post-facto negotiations with the ECB in order to determine how assets and liabilities should be resolved. The best solution is likely simply default and a reduction of existing liabilities in whole or in part. 
13. Institute labor market reforms in order to make them more flexible and de-link wages from inflation and tie them to productivity. Inflation will be an inevitable consequence of devaluation. In order to avoid sustained higher rates of inflation, the country should accompany the devaluation with long term, structural reforms." 
However, there is one very important thing officials must continually do before implementing this 13 step program. Deny, Deny and Deny some more.

That very important step is still not being ignored by Eurozone chief Jean-Claude Juncker, as Reuters reports today:
"We've got a 17-member euro zone. Greece's exit is not a working hypothesis for us," Juncker told the European Parliament's economic committee.
Suuuure. And I agree with Variant Perception below
"Any euro exits would likely happen quickly and in rapid succession and would be done in a “surprise” announcement over a weekend while capital controls and bank holidays are imposed."
"Almost all emerging market devaluations were “surprise” devaluations, and there is no reason to believe that any exit from the euro would not be a surprise as well."
"In devaluations, the announcements are typically made over the course of a weekend, particularly when capital controls can be imposed. If necessary, Monday and Tuesday could be declared bank holidays as well. This was the case, most notably, with Argentina in 2002 where the announcement was made Sunday and then two days of bank holidays were declared." 
Those with their money in Greek banks aren't being stupid.

Another nice paper on the subject of a Greek exit if you have the time is "More Pain, No Gain for Greece" from the Center for Economic and Policy Research.


Monday, February 27, 2012

Consumer Spending: Where does your money go?

According to an ongoing Gallup poll the average American reports spending $66 per day, not including the purchase of a home, car, or regular household bills. This is down from $104 per day reported in January 2008, the month after the recession started (isn't it great the recession is over!)

Below is a nice infographic from Credit Donkey on how households spend their money. How does your spending stack-up? I'm definitely over on the percent I'm allocating to the "away from home" food budget. Ah, the downfall of city living!  
Infographics: Where Does All My Money Go
Am I the only one surprised that the average person in the US still writes about 8 checks per month?

Monday, February 13, 2012

The Numbers behind Valentines Day - Infographic Mashup


Here is a mashup of pieces of infographics from around the web showing the numbers behind Valentines Day. These are from Frugal DadH&R BlockFedExOverStock.comOnlineMBAHistory.comLiveScience.com, Monetate & Boticca (you can click on each image to see it's full corresponding infographic). Am I missing some good ones?

Monday, February 6, 2012

Some Commentators Still Clueless That Fed's Zero Interest Rate Policy (ZIRP) Is A Backdoor Bank Bailout

I have seen some pretty off-base commentary about the Federal Reserve's Zero Interest Rate Policy (ZIRP) over the past week. The first was from Matthew Philips and Dakin Campbell over at Bloomberg BusinessWeek in an article titled "The Hidden Burden of Ultra-Low Interest Rates". Now you might assume that an article with that title is going to dig into some details about how ZIRP is robbing retirees and savers and funneling easy money to the banks so they can cover up their losses. However, you would be mistaken.While that is what ZIRP does, unfortunately it's not what the article is about. (bold added by me)
"The Federal Reserve, which cut its target for the federal funds rate to a zero-to-0.25 percent range on Dec. 16, 2008, said last month that rates would remain “exceptionally low” at least through late 2014. While the unprecedented period of near-zero rates is meant to aid an ailing economy, it poses challenges for banks, insurers, pension funds, and savers.
The hope is that by making mortgages and other loans cheaper, ultra-low rates eventually may revive economic growth. For now they’re squeezing profits at banks and disrupting investment strategies at insurance companies and pension funds. 
Yes you are reading that right. Free money from the Fed is "squeezing profits at banks"! The whole article focuses little on savers except one quote from Barry Ritholtz which is on point.
"“For most people, there’s been more downside to these low rates than upside,” says Barry Ritholtz, CEO of Fusion IQ, an independent research firm. “They’ve punished savers and people living on fixed income, and made insurance more expensive.”"
You will notice he mentioned nothing about banks being punished. However, this doesn't stop the writers from going on with the bogus narrative which they conclude as follows:
"The bottom line: Near-zero interest rates have hurt bank and insurance company profits and contributed to a $236.4 billion increase in pension underfunding."
While correct about hurting pension funds, the article is missing one "tiny" detail about banks........ZIRP is the only reason banks have profits!! (well ZIRP and every other bailout thrown their way). ZIRP is sold to the public by saying that "by making mortgages and other loans cheaper, ultra-low rates eventually may revive economic growth". Great idea, since too much debt got us into the problem, we will revive the economy by encouraging more debt and stopping any money from flowing into the economy through interest on savings. Should anybody be surprised it has not worked?

The real beneficiaries are the Banks. How can getting money for free be "squeezing profits" at the banks as they said? It's not. The banks didn't even fully pass on the savings from ZIRP to consumers in the form of lower rates. Bank's borrowing costs went from 5.25% to 0.1% (or a 98% reduction). The chart below shows how much consumers "benefited" from lower rates by comparison.

Ya, not so much. Or another way to look at it.

The highlighted area is where the Fed lowered rates from 5.25% to essentially 0. Not only did spreads increase in banks favor but it encouraged banks to take the easy money and just buy Treasuries rather than lend it out to consumers. Get money from the Fed at 0%, lend it to the Government for 2%...repeat. And that is exactly what they did.

The primary purpose of ZIRP was (and is) a backdoor bailout for banks......not to help consumers with lower interest rates as advertised. Anyone still under the illusion that it had to do with encouraging lending might want to find out why the Emergency Economic Stabilization Act of 2008 included a provision for the Fed to pay interest to banks on reserves (which they never did before). Obviously paying banks NOT to lend money isn't going to encourage lending. It shouldn't come as a surprise that excess reserves shot up after this was enacted.

Despite it being undeniably clear that the Fed's ZIRP is robbing the saver to benefit the Banks, we get this article from Joe Weisenthal at Business Insider "DEAR SAVERS AND RETIREES: Stop Whining About Those Lousy Rates You're Getting From The Bank". It includes this gem:
"But why can't Bernanke just, you now, raise rates or something!? 
Well think about what that means: Essentially people are asking the central bank to create a special carve-out in the economy, where despite all that's happening, one class of people—savers—gets to have above-average returns on their money."
So Joe realizes that it's not fair to create a special carve-out in the economy for one class of people but remains utterly ignorant to the fact that is EXACTLY what the Fed is doing....For the banks! The Federal Reserve Bank of St. Louis makes it quite clear
"By keeping short-term interest rates low, the Fed helps recapitalize the banking system by helping to raise the industry’s net interest margin (NIM), which boosts its retained earnings and, thus, its capital."
Is that not a special carve-out?

Sunday, January 29, 2012

Morningstar Ramps Up Analyst Ratings for Mutual Funds. Positive Bias Continues.

UPDATE: 8/1/12 - You can see updated ratings as of 6/30/12 here.
-----------------------------------------------------------------------------------
Morningstar continues to roll-out its new 'forward-looking' analyst ratings for mutual funds. When I wrote about these ratings in November after their initial launch they had ratings for 349 funds. They have increased that to 410 (as of 12/31/2011). You can download the complete listing here.

As a refresher here is what Morningstar says about it's new rating system
"Unlike the backward-looking Morningstar Rating™ (often referred to as the "star rating"), which assigns 1 to 5 stars based on a fund's past risk- and load-adjusted returns versus category peers, the Analyst Rating is the summary expression of Morningstar's forward-looking analysis of a fund. Morningstar analysts assign the ratings on a five-tier scale with three positive ratings of Gold, Silver, and Bronze, a Neutral rating, and a Negative rating.
The Analyst Rating is based on the analyst's conviction in the fund's ability to outperform its peer group and/or relevant benchmark on a risk-adjusted basis over the long term. If a fund receives a positive rating of Gold, Silver, or Bronze, it means Morningstar analysts think highly of the fund and expect it to outperform over a full market cycle of at least five years."
So far it appears that this system is going to suffer from the same problems which plague stock ratings.....a lack of negative ratings. Despite the fact that the majority of mutual funds under-perform their benchmarks, only 4% of Morningstar's 410 analyst ratings are "negative".

Morningstar has still not clarified how 21 index funds have managed to receive "metal" ratings. After all, how does an index fund outperform it's benchmark? By their own definitions, the best an index fund should be rated is "neutral". Yet every index fund they have rated up to this point has received a rating higher than Neutral (with the majority getting 'gold' ratings).

Below is a chart breaking down fund attributes by each rating

Nothing too shocking here. The average fund receiving their highest "forward looking" grade also has a higher backward looking star rating. Fund expenses are lower and manger tenure is longer. The most questionable aspect comes into play regarding fund size. Many funds that performed well in the past did not necessarily do so with large asset bases, the assets usually came after the performance. With "gold" rated funds having such large asset bases on average, will they be able to outperform going forward?

I will be checking up on Morningstar's roll-out of their new ratings from time to time and will definitely check up again this time next year to see how this batch of ratings has performed.

Monday, January 23, 2012

Who Owns The World's Financial Assets? And Why Are U.S. Households So Fascinated With Stocks?

I came across an interesting report from McKinsey Global Institute. The report includes a breakdown of the ownership of the world's financial assets as of the end of 2010. I used their information to make the below chart. 

What is interesting is the U.S. fascination with equities. It should be noted that the definition of financial assets in their report excludes "the value of real estate, derivatives, physical assets such as gold, and equity in unlisted companies."  The total value of the world's financial assets equaled $198.1 Trillion and the total value of all equities equaled $53.7 Trillion. Clearly equities, bonds, bank deposits and such are massively overshadowed by the notional value of the derivatives market which is over $700 Trillion.

Drilling down to the household level in the US reveals some more interesting observations. However, unfortunately this does not include retirement accounts (but that would only increase the equity allocation since US retirement accounts hold about a 60% allocation to stocks).

The yellow line in the graph is the inflation-adjusted S&P index. You can see how long-term market trends have affected investors asset allocations through time, with investors predictably increasing/decreasing allocations at the wrong times. But I think what is clear here, is that everyone who is saying that investors are too pessimistic.....they don't know what true pessimism looks like. Investor pessimism in the US looks more like their allocations in 1945-1950 or 1975-1990. Coincidentally, that is also when generational buying opportunities presented themselves......Sorry folks, now is not a generational buying opportunity by any stretch of the imagination, despite all those who use idiotic forward PE ratio's or useless graphs of the "fed model" to tell you otherwise. Please see below some more useful market valuation indicators which actually have a strong correlation with subsequent longer-term returns (this chart is from Doug Short at Advisor Perspectives)

The market is by no means cheap. In fact, it has only been more expensive than this (based on the Shiller PE10 ratio) about 20% of the time (and those resulted in poor longer-term returns). 

If you want to see true investor pessimism towards stocks, then look no further than Japan

And a sampling of some other countries........

I have little doubt that as the US population continues to age and the younger generation gets a sour taste in their mouth regarding stocks we will see the overall allocation to stocks by US investors continue to decline, then finally when everyone believes stocks are a losers game, it will finally be the next generational buying opportunity.


Thursday, January 19, 2012

World Bank Issues The World A Rare Reality Check

The World Bank recently released it's "Global Economic Prospects" report for 2012. Organizations such as the World Bank tend to do their fair share of sugar-coating issues, however, their most recent report is about as blunt as you are likely to see from them in regards to the economic outlook.
"The world economy has entered a very difficult phase characterized by significant downside risks and fragility."
".....as a result forecasts have been significantly downgraded."
"However, even achieving these much weaker outturns is very uncertain."
"While contained for the moment, the risk of a much broader freezing up of capital markets and a global crisis similar in magnitude to the Lehman crisis remains. In particular, the willingness of markets to finance the deficits and maturing debt of high-income countries cannot be assured. Should more countries find themselves denied such financing, a much wider financial crisis that could engulf private banks and other financial institutions on both sides of the Atlantic cannot be ruled out. The world could be thrown into a recession as large or even larger than that of 2008/09."
Oh and for all those who are still deluding themselves into believing the idea that Europe will avoid a recession in 2012. According to the World Bank "Europe appears to have entered recession" which they estimate to have begun in the 4th Quarter of last year. Again this should not be a surprise to anybody, but for some reason people deny it until organizations such as these put their official stamp of approval on it (and there will probably still be deniers all the way up until each individual country makes it official.....big delay).

Here is a chart of the World Bank's estimates for GDP growth using 3 different scenarios they presented

According to the world bank regarding the baseline forecast...
"The baseline projections.....assume that efforts to-date and those that follow prevent the sovereign-debt stress of the past months from deteriorating further, but fail to completely eradicate market concerns."
I think their baseline assumptions are pretty optimistic. And regarding the contained crisis scenario...
"it is assumed that one or two small Euro Area economies (equal to about 4 percent of Area GDP) face a serious credit squeeze.
"It is assumed in this scenario that although borrowing costs in other European economies rise and banks tighten lending conditions due to losses in the directly affected economies, adequate steps are taken in response to the crisis to ensure that banking-sector stress in Europe is contained and does not spread to the rest of the high income world."
And finally regarding the larger crisis scenario....
"the freezing up of credit is assumed to spread to two larger Euro Area economies (equal to around 30 percent of Euro Area GDP)."
"Repercussions to the Euro Area, global financial systems and precautionary savings are much larger because the shock is 6 times larger"
In their conclusion:
The global economy is at a very difficult juncture. The financial system of the largest economic bloc in the world is threatened by a fiscal and financial crisis that has so far eluded policymakers’ efforts to contain it. Outside of Europe, high-income country growth, though strengthening, remains weak in historical perspective. At the same time some of the largest and most dynamic developing countries have entered a slowing phase.
These are not auspicious circumstances, and despite the significant measures that have been taken, the possibility of a further escalation of the crisis in Europe cannot be ruled out. Should this happen, the ensuing global downturn is likely to be deeper and longer-lasting than the recession of 2008/2009 because countries do not have the fiscal and monetary space to stimulate the global economy or support the financial system to the same degree as they did in 2008/09. While developing countries are in better shape than high-income countries, they too have fewer resources available (especially if international capital is not available to support deficit spending). No country and no region will escape the consequences of a serious downturn.
I'll leave you with random charts I found interesting from the report


Yes that is China growing from using 5% of the world's metal consumption to about 41% currently....now how much of that consumption is productive vs wasted building ghost cities, is another question.