While I believe the purpose of these types of headlines and tweets are to illicit positive emotions, readers would be well advised to look up the DISASTROUS history of extended periods of unified Republican governments.
In fact, the ONLY 3 PERIODS of extended unified Republican governments going back to 1900 ALL DIRECTLY led to banking crises....Arguably the 3 worst in US History. To be clear, I am defining 'extended' unified governments as anytime they control the House, Senate and White house for at least 4 years. This does not include short 2 year stints since it's hard to screw things up that quick (FYI there was only 1 period of that anyway, 1953-1955). You can look up the periods yourself here and more detail here.
The list of Unified Republican Government crises include the Panic of 1907, The Great Depression, and the Financial Crisis of 2007-2008. Interestingly, the record of extended Republican control of Congress has also only led to crises. There have only been 4 periods of extended Republican control of Congress (3 of which overlap with the periods of full unified control just mentioned). However, the 4th period (I KID YOU NOT) ended in the 2000 DotCom Bust where the Republicans controlled the House and Senate from 1995-2001.
In short, full Republican control has NO history of making America great...let alone AGAIN. Don't feel like checking out that history yourself? Here's what you'll find....

Technically Republicans took control in 1895 but this graph does not start there. And While I mentioned the Panic of 1907......I will just brush off the Panic of 1901. Markets fell over 43% before bottoming after both events. How they were not thrown out until 1911 is anyone's guess.

Then we have the Great Depression fuelled by the unsustainable laissez-faire polices of the roaring 20's.

Only led to the greatest market decline in history and total social devastation.....Is that the type of "Great" we want to make again?

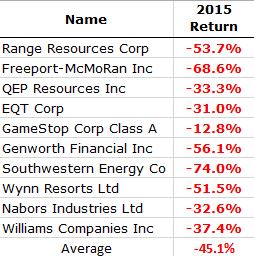
Oh and then we have the Financial Crisis of 2007-2008.

This case meets the minimum for "extended" by getting to 4 years (although technically they almost had 6 full years as only 1 independent tipped the senate democrat in 2001). Again lax regulations created the housing bubble which popped in 2006 and lead to our famous bank failures and financial crisis. (Case Shiller housing price index)

While the Republicans managed to get kicked out of Congress in 2007 the coming disaster was already well in motion by then.

While that wraps up the History of the 3 worst banking crises in American History...or um....I mean the History of the "Unified Republican Government". It would not be complete without completing it with the final piece to the history of the extended Republican control of Congress....which is only complete with the DotCom Bust of 2000.


There we have it folks! The disastrous history which has accompanied EVERY extended Unified Republican Government (or control of congress) since 1900. Think I'm missing a period that didn't end in disaster? Check for yourself. I'm not.