Showing posts with label price targets. Show all posts

Saturday, January 30, 2016

Analyst Price Targets Gone Wrong

So I was recently browsing a report by FactSet which aggregates analyst price target data for stocks. So for fun, I went back to last year's report to see what was said and how things turned out.....Results? Ugly.

First, I looked at their interesting chart which shows the top 10 stocks in the S&P 500 whose price at the start of 2015 was most significantly below its aggregate analyst price target.

The average of these 10 stocks were 45.7% below their price targets. Wow, sounds awesome, why not just make a portfolio of these 10 stocks and roll with it...+47.5% returns here we come! Well, here is how that would have turned out.

No, I did not reverse the signs....they actually were THAT bad! They had the average % return correct.....JUST IN THE WRONG DIRECTION!! Remember folks....the S&P 500 returned +1.4% in 2015, if you equal weighted all 500 stocks it still would have been only -2.2%. It's quite a feat to do this badly.

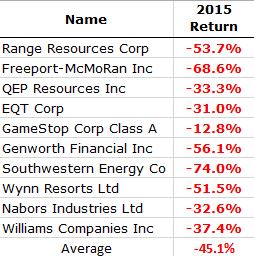
How about the stocks whose aggregate price targets were most BELOW their starting price in 2015? The stocks they thought would do worst?

Here, on average, they expected these stocks to decline -12.1%. And the results?
Well atleast the average fall was close but what I hope your noticing is how much BETTER these did then those expected to perform best. Not only that but this group actually included 4 stocks that were positive and 6 stocks that performed better than the equal weighted S&P 500.

Lastly, how about just a bottom up look at expected sector returns? What were they saying in 2015?
Ok, so they were expecting 6.8% for the S&P and it returned 1.4% but what about if you want to use this to overweight some sectors? How about if you just equal weight the top 5 sectors (Energy, Materials, Industrials, Telecom & Health Care)? That would give you an expected return of 10.0%. Results?

Terrible, enough said.


Wednesday, April 4, 2012

The Lovely World of S&P Analyst Price Targets

If you want a good chuckle you can always turn to a S&P stock report. Take for example their recent research report on Netflix. Right there at the top of the report they blessed the stock with a "Buy" rating and slapped a 12-month price target of $135 on it. Who can complain with a 17% gain? Looks like it's time to buy!

Oh wait, what is this on page 3?

Gotta love it! So on the one hand their analyst is saying 'Buy" because with a price target of $135 it is 17% undervalued. Then your later being told that, by the way, our "proprietary quantitative model" says you should lose about 42% listening to that Analyst.

This isn't some one-off thing, in fact, it is amazingly common. How about Boeing? Looks like another buy! Price Target $86. Not a bad 16% gain.

Oh wait......

Sorry, S&P actually says you should lose 27%.

So how about something your not being told to buy? Chipotle...

Don't worry, your not the only person wondering why something has a "Hold" rating when it's price target is 11% lower. However, to the analysts credit the "hold" rating was put on when it was trading at $378 (but don't give too much credit -- why is he recommending to hold something he thinks should go down in price?)

Worse yet, not only does the analyst think it's overvalued but so does S&P's "fair value calculation". By 30% in fact. Yet still no "Sell" rating?

I think you get my point......These "Price Target's" are pure humor. And as you may have guessed, the corresponding star ratings provide nothing useful in performance -- and actually have detracted as you can see in the below performance of their "All Stars" basket of stocks vs the regular S&P 500.


You gotta love these "useful" price targets!